 |
rabbit control 2010-11 |
|
Ahead of a planned rabbit control program by the Parks and Conservation Service (PCS) in Autumn 2010, fotpin assisted PCS to identify rabbit warren locations and to provide a baseline estimate of the rabbit population using the surrogate measure of active entrances, that is the number of actively used rabbit burrows. This complemented the PCS spotlight counts used to estimate the rabbit population. Following the fumigation, both the fotpin active entrance survey and the PCS spotlight counts were repeated, in March 2011, to assess the effectiveness of the control measures. Details of the monitoring procedure can be found below. On the basis of this monitoring it was estimated that the number of active burrows declined by 83% between March 2010 and March 2011, most of this decrease having occurred by August. There was a similar, but smaller, decline of 64% in the number of active warrens, indicating that there were fewer active burrows per warren than before fumigation. The results of the fotpin monitoring were compared with those from the regular PCS Spotlight Count surveys (see below for details). The PCS figures suggested a decline of 70% in rabbit numbers over the same period. We concluded that:
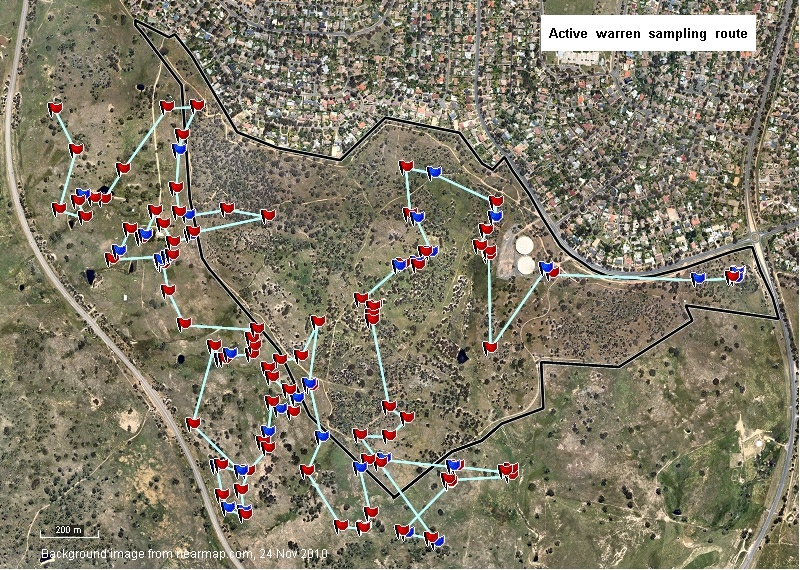
Details of the 2010-11 Warren Monitoring and Spotlight Counts fotpin rabbit warren monitoring strategy In March and April 2010 fotpin mapped the location of rabbit warrens across The Pinnacle, Bottom Pinnacle and North Kama (see location map). This mapping was to assist PCS to identify and prioritise warrens for control, collecting information on warren size (number of active entrances), rockiness, and position in the landscape. Armed with a handheld gps, fotpin volunteers surveyed the whole area by walking transects spaced at between 10m and 30 m apart depending on the density of vegetation. We mapped 278 active rabbit warrens (not including the very large warren known as "rabbit central" located in the Central Paddock). A feral pest control company was then contracted by PCS to fumigate known warrens in late autumn 2010. Active burrow entrances may be used as a surrogate for below ground rabbit populations. With this in mind fotpin set out to estimate and monitor the rabbit population, using the pre-control results from the autumn 2010 survey as a baseline. A sub-sample of 126 of the pre-control warrens were surveyed for activity in late winter (August 2010) and again in early autumn (March 2011) to monitor the benefits of control treatments carried out in late autumn and changes during spring. The sample of warrens included all mapped "large" warrens (defined as having 6 or more active burrows, n=90) and a sample of 36 "small" warrens (1-5 burrows) efficiently surveyed en-route between the larger warrens (see Figure 1). This therefore assumed a risk-based approach to monitoring warrens, given the large warrens represented a potentially larger number of rabbits and are source warrens for the formation of new warrens elsewhere in the reserve.
Whilst all mapped "large" warrens were surveyed at each monitoring event, the sampling of "small" warrens was dependent on their proximity to an efficient route between the large warrens, and therefore was not a consistent sampling of warrens across the Reserve, for example no small warrens were monitored in the Weetangera Paddock, whilst 35% of small warrens were surveyed in the Central Paddock (Table 1).
Table 1: Number of rabbit warrens and percentage monitored in each management area
Active entrance estimates The total number of active entrances was estimated for each monitoring event through summation of the observed number of active entrances in the large warrens and an estimate of total active entrances in small warrens. Where the proportion of small warrens monitored in a paddock was the same or greater than the overall proportion of small warrens monitored (ie >= 19%) the average number of active warrens and average number of entrances was used for that paddock. Where the proportion was less than 19% the average value for the total area was used. The results are shown in Table 2. The monitoring suggests that after the fumigation treatment in autumn 2010 there was a reduction of 50% in active warren numbers and 70% in the total number of active burrows. Thus not only did the number of active warrens decline as a result of treatment, but the size the the warrens also declined (by 40%, from an overall average of 3.4 entrances/warren in March to 2.0 in August 2010). It can be concluded that treatment was effective, if not complete. There was a further reduction of 10% in both active warrens and active burrows over spring and summer of 2010-11. Table 2: Active warrens and burrow entrances
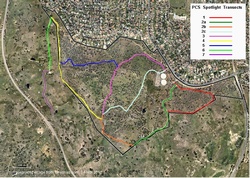
Comparison with PCS spotlight rabbit surveys fotpin's active entrance surveys were conducted at the same time as the the ACT Government's Parks and Conservation Service conducted spotlight counts to estimate the rabbit population of The Pinnacle Nature Reserve. Counts were done along transects (see Figure 2), and were repeated on successive nights.
The results of the spotlight surveys showed that after the fumigation treatment in autumn 2010 there was a reduction of 50% in the number of rabbits observed, and a further 20% reduction over spring and summer 2010-11. These effects are roughly the same as those deduced from the active burrow counts. Summary Overall, between March 2010 and March 2011 there was a decline of:
Further Information Managing Rabbits in Canberra Nature Park, A report to the ACT Commissioner for Sustainability and the Environment by Dr Kent Williams [ Rabbit mapping Field data sheet used in March 2010 [
|
||||||||||||||||||||||||||||||||||||||||||||||||||||||||||||||||||||||||||||||||||||||||||||||||||||||||||||||||||||||||||||||||||||||||||||||||||||||||||||||||||||||||||||||||||||||||||||||||||||||||||||||||||||||||||||||||||||||||||


© Friends of The Pinnacle