|
|
An important aspect of the Weed Management Plan is monitoring and reporting on our interventions. This includes monitoring our weeding effort to know how our resources have been deployed, and to compare it with the requirements projected in the plan and effort in previous years.
Data on this page is for the year 1 July 2013 to 30 June 2014.
Weeding effort for the current year, updated monthly, can be found at weeding effort. Effort can also be viewed for the completed years 2010-2011, 2011-2012 and 2012-2013.
|
| Tip: Hover mouse over chart thumbnail to see full size chart. |
|
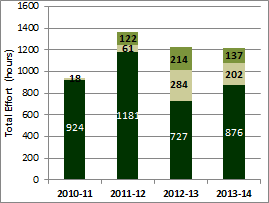
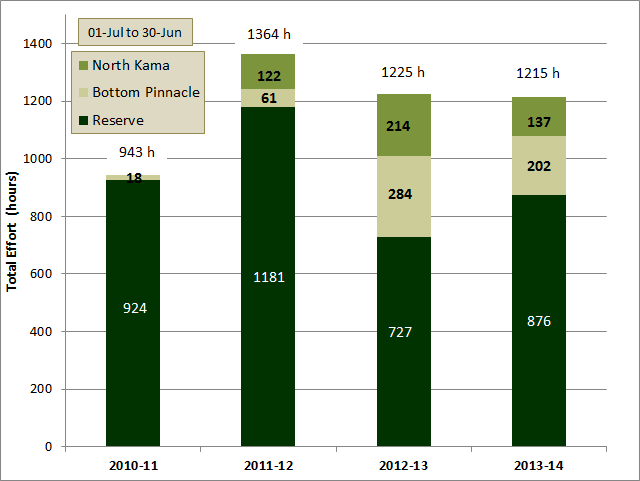
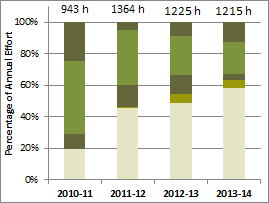
The chart shows the total effort for each of the last three seasons, divided into the time spent in the Reserve, Bottom Pinnacle and North Kama paddocks.
|
Total Effort
Between 1 July 2013 and 30 June 2014, the amount of effort deployed in weed management was 1215 hours.
The chart to the left compares this season's effort with previous seasons and shows how the effort was apportioned between the Reserve, the Bottom Pinnacle and the North Kama paddocks. Although the total amount of effort in 2013-14 was the same (within < 1%) as in 2012-13, the effort spent on the Reserve was 20% more and represented 72% of our total effort for the season.
|
| |
|
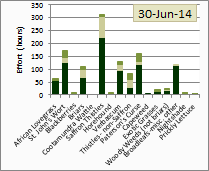 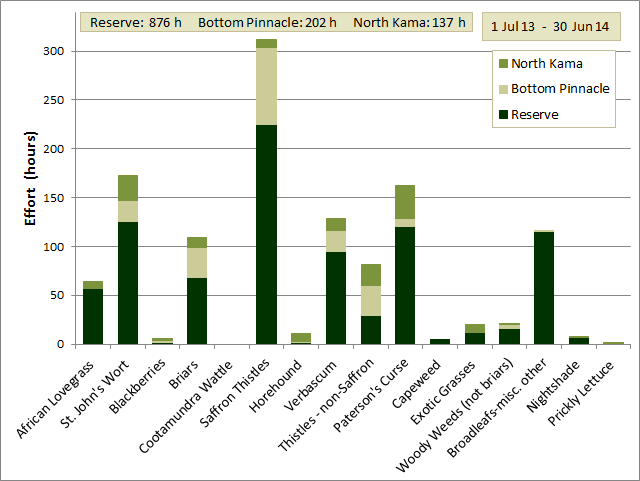
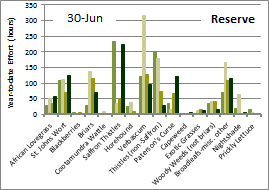
This chart shows the total effort for each weed type across all paddocks. |
Effort for different weed types
This chart shows the total effort for each weed type and how that was distributed between the Reserve and neighbouring paddocks. The greatest effort was spent on Saffron thistles (225 hours on the Reserve, 312 hours total). This was almost double that spent on any other weed type.
For the amount of effort spent on each weed type in each paddock, see relative prevalence of each weed type in each paddock. |
|
Reserve |
Other |
Total |
| Saffron Thistles |
26% |
26% |
26% |
| St. John's Wort |
14% |
14% |
14% |
| Paterson's Curse |
14% |
12% |
13% |
| Broadleafs-misc. other |
13% |
0% |
10% |
| Verbascum |
11% |
10% |
11% |
| Sweet Briars |
8% |
12% |
9% |
| African Lovegrass |
6% |
2% |
5% |
| Thistles - non-Saffron |
3% |
15% |
7% |
| Woody Weeds (not briars) |
2% |
1% |
2% |
| Other |
3% |
6% |
4% |
|
|
The percentage of total effort for each of the top nine weed types (and the rest) is shown in the table for the Reserve, the combination of Bottom Pinnacle and North Kama (Other) and all areas (Total). [As a guide to interpretation, 8% of the total effort spent in the Reserve, 12% of the total effort in the other paddocks, and 9% of the total effort was spent on Sweet Briars].
There is a high degree of correlation between the apportioning of our effort for the Reserve and Other paddocks for most weed types, much higher than in the previous season. Two exceptions are worthy of comment: a large proportion of effort was spent on miscellaneous broadleafs (mainly Fleabane, flatweed and skeleton weed) in the Reserve, but it was not considered a high priority in the neighbouring paddocks; and a much larger proportion of time was spent on non-Saffron thistles in the neighbouring paddocks because these thistles were not as prevalent in the Reserve this season, we hope because of successful treatment in previous years.
|
 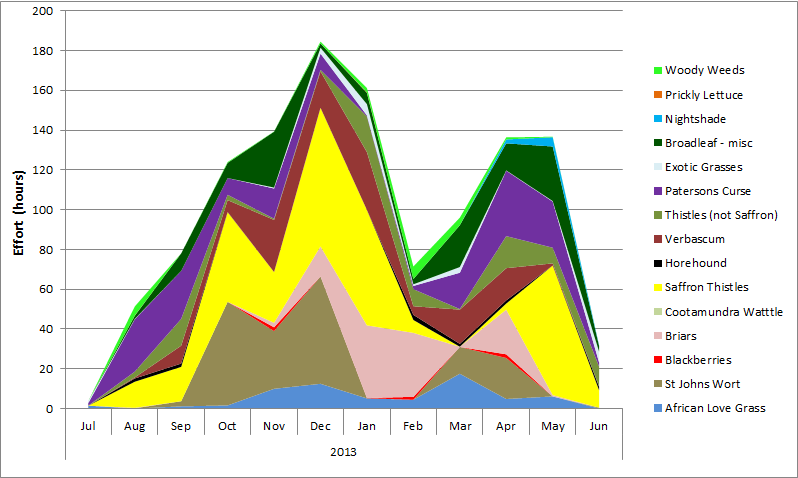
This chart shows the change from month to month of weeding effort for the different weed targets. |
To see how our effort for each weed type changed through the season, hover over the chart to the left, and/or visit the monthly effort page. Monthly effort for each type can also be compared for the past three seasons by visiting the monthly history page.
For an even more detailed view, and a comparison with last season, visit the weed type
effort over time page. |
| |
|
 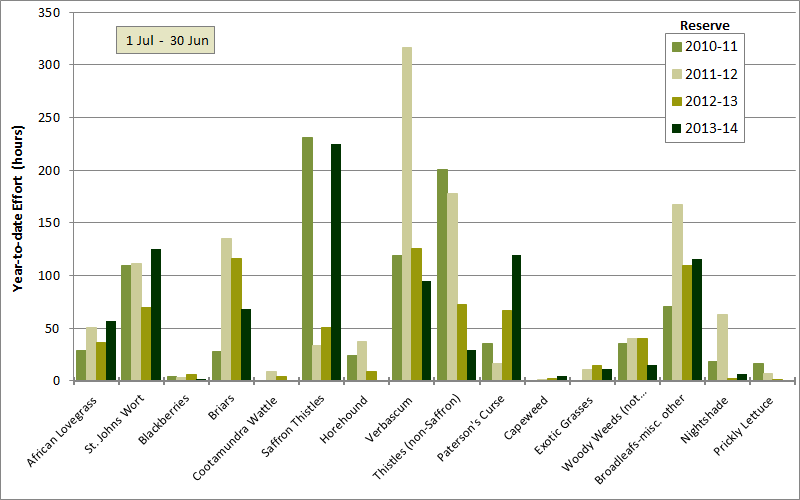
This chart shows the comparison of effort for each weed type targeted in the Reserve across the last three seasons. |
Comparison of effort for each weed type with previous years
The chart to the left shows the amount of effort in the Reserve in each of the last four seasons for each of the weed types targeted. Effort is restricted to the Reserve because of the gradual expansion of weed control into the neighbouring paddocks over those years. Comparison of effort for the Reserve alone therefore provides a better indication of weeding effort required to control each weed type. To see the equivalent chart for the Reserve and neighbouring paddocks combined, open the comparison for the combined Reserve and neighbouring paddocks window.
While there are considerable differences in effort between seasons for some weed types, others are quite close. Much more time has been spent on Saffron thistles this season than in the previous season, though similar to the bumper season of 2010-11. Although their prevalence was less this season than in 2010-11, greater effort was devoted this year to early intervention in spring by spraying and daubing and late intervention in Autumn by spraying to try to make more progress controlling this intractable weed. Similarly much greater effort was spent on St. John's Wort this season, again not because the infestation was greater but because we extended the spraying season by starting earlier and finishing later rather than just concentrating effort during their flowering period.
On the other hand much less effort was spent on non-Saffron thistles, Horehound and Nightshade because of their decreased prevalence this season.
For a more detailed discussion of season to season differences, see season comparison page.
|
| |
|
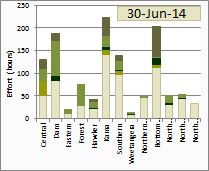
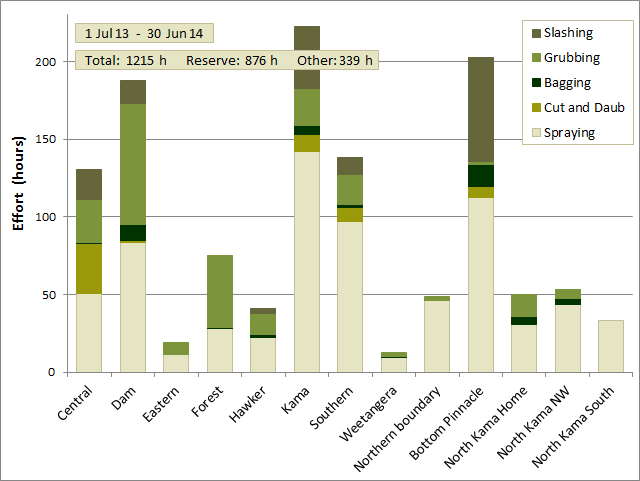
The chart shows the total effort for each paddock, divided into the time spent using different weed control methods.
|
Effort in Different Paddocks
The chart to the left shows the total effort for each paddock, separated into the time spent applying each weed control method.
This chart is presented as total effort in each paddock. In order to judge relative levels of infestation by each weed type in different paddocks, the chart can also be viewed as the effort per hectare in each paddock for each weed type targeted. On that web page it can be seen, among other things, that the Eastern paddock received the second greatest effort per hectare for St. John's wort (perhaps a little surprising to some). Kama and Central paddocks received the most effort/ha (on the Reserve) for Saffron thistles, and Kama also required the most effort/ha for Verbascum and Paterson's curse of any of the paddocks on the Reserve. |
| |
|
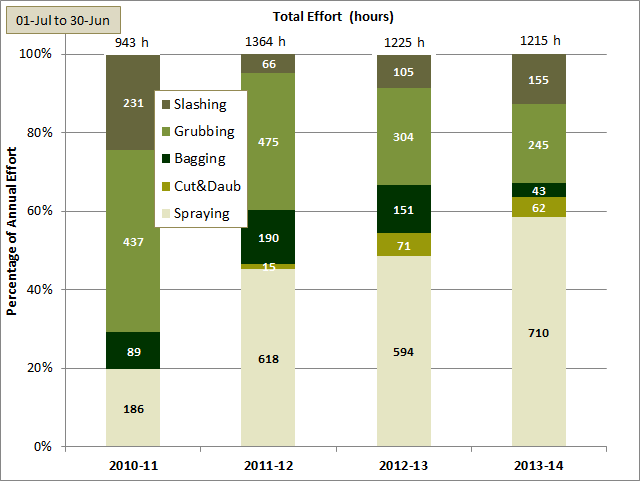
The chart shows the total effort in each year, divided into the time spent using different weed control methods. |
Effort spent on different control methods
This chart shows the total effort in each year apportioned into the different control methods. The percentage effort is shown on the left hand axis and the absolute hours on the chart bars themselves.
Obvious features include: the big increase in spraying after 2010-11, as we emphasised that as the preferable control method; the gradual decrease in bagging after 2010-11 as the increased spraying allowed more effective control of weeds prior to maturity; and a steady decrease in grubbing as a control method as we aim to minimise the soil disturbance causes by using this method. |
| |
|
The chart shows the total effort for each paddock, divided into the time spent grubbing and pulling weeds and that spent spraying.
|