|
|
An important aspect of the Weed Management Plan is monitoring and reporting on our interventions. This includes monitoring our weeding effort to know how our resources have been deployed, and to compare it with the requirements projected in the plan and effort in previous years.
Data on this page is for the year 1 July 2014 to 30 June 2015.
Weeding effort for the current year, updated monthly, can be found at weeding effort. Effort can also be viewed for the completed years 2010-2011, 2011-2012, 2012-2013, 2013-2014 and 2014-2015. |
| Tip: Hover mouse over chart thumbnail to see full size chart. |
Total Effort |
|
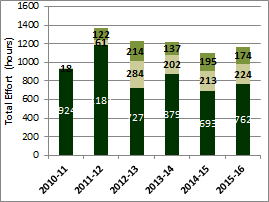
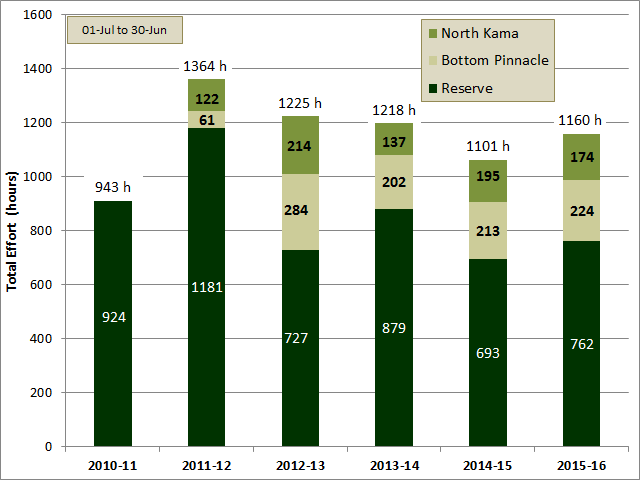
The chart shows the total effort for each of the last five seasons, divided into the time spent in the Reserve, Bottom Pinnacle and North Kama paddocks.
|
Between 1 July 2015 and 30 June 2016, the total amount of effort deployed in weed management was 1160 hours. This was 5% more than last season and within 1% of the average of the previous 5 seasons. The amount of time spent on the Reserve itself was 10% more than last season; 66% of the total effort this season was spent on the Reserve.
The graph to the left shows a consistent level of total effort from 2012-13 to 2014-15 of between 1101 and 1225 hours. This is interesting given that we are controlling more weed types over a greater area in recent seasons than in 2011-12 and have had some very large infestations. One possible explanation is that control is now more efficient because of our increased usage of spraying (45% of total effort in 2011-12 increasing to 65% in 2015-16) and our improved knowledge of where each weed type is located through our intensive mapping. In addition it may be evidence that we are slowly having a lasting impact on weed infestation.
|
| |
|
Effort for different weed types |
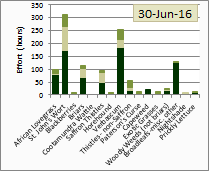 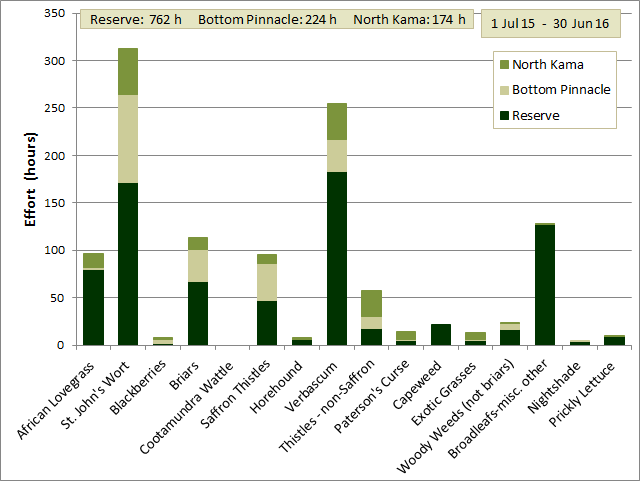
This chart shows the total effort for each weed type across all paddocks. |
This chart shows the total effort for each weed type and how that was distributed between the Reserve and neighbouring paddocks. The effort spent on two weed types stands out as more than double that spent on the third type and 50% of all effort. The greatest effort was spent on St. John's Wort (172 h on the Reserve, 312 h total). This was 74% more than last season. Close behind was Verbascum (183 h on the Reserve, 255 h total). In both cases these weeds were favoured by the weather conditions this season, namely above average summer rainfall and relatively warm conditions throughout the season.
In the Reserve, most effort was spent on Verbascum (183 h) closely followed by St. John's wort (172 h), then miscellaneous Broadleaf weeds (127 h), African Love Grass (80 h), Briars (67 h) and Saffron thistles (47 h).
For the amount of effort spent on each weed type in each paddock, see relative prevalence of each weed type in each paddock.
|
|
Reserve |
Other |
Total |
| St. John's Wort |
23% |
35% |
27% |
| Verbascum |
24% |
18% |
22% |
| Miscellaneous Broadleaf weeds |
17% |
0% |
11% |
| Briars |
9% |
12% |
10% |
| African Lovegrass |
10% |
4% |
8% |
| Saffron Thistles |
6% |
12% |
8% |
| non-Saffron Thistles |
2% |
10% |
5% |
| Other |
9% |
8% |
9% |
|
|
The percentage of total effort for each of the top nine weed types (and the rest) is shown in the table for the Reserve, the combination of Bottom Pinnacle and North Kama (Other) and all areas (Total). [As a guide to interpretation, 23% of the total effort spent in the Reserve, 35% of the total effort in the other paddocks, and 27% of the total effort was spent on St. John's Wort].
There is a high degree of correlation between the apportioning of our effort for the Reserve and Other paddocks for most weed types. Two exceptions are worthy of comment: a large proportion of effort was spent on miscellaneous broadleafs (mainly Fleabane, flatweed and skeleton weed) in the Reserve, but it was not considered a high priority in the neighbouring paddocks; and a much larger proportion of time was spent on African Love Grass on the Reserve than in the neighbouring paddocks because it is a higher priority on the Reserve.
|
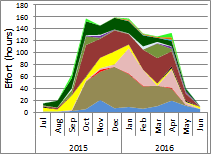 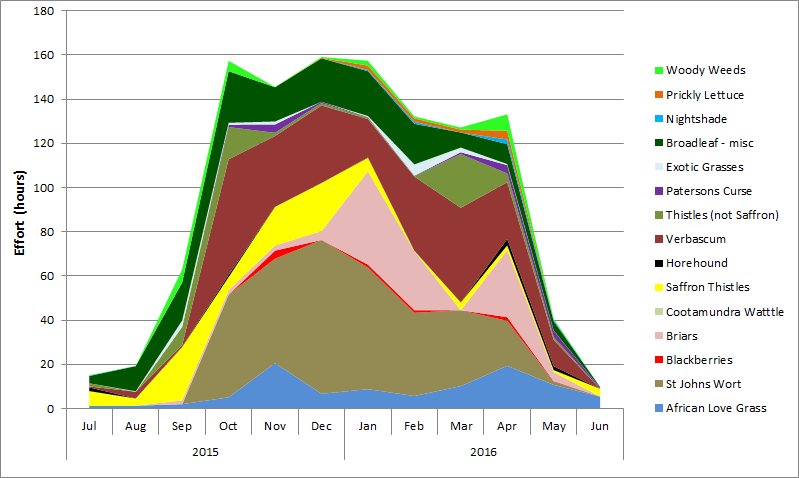
This chart shows the change from month to month of weeding effort for the different weed targets. |
To see how our effort for each weed type changed through the season, hover over the chart to the left, and/or visit the monthly effort page. Monthly effort for each type can also be compared for the past five seasons by visiting the monthly history page.
For an even more detailed view, and a comparison with last season, visit the weed type
effort over time page. |
| |
|
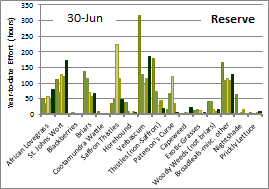 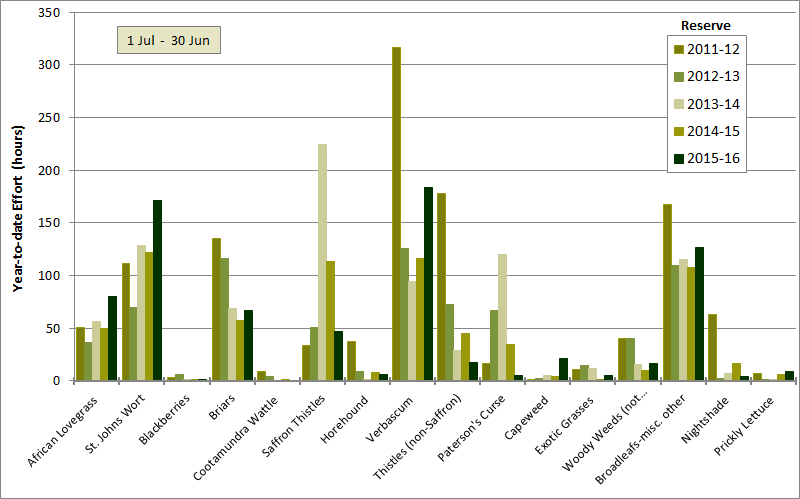
This chart shows the comparison of effort for each weed type targeted in the Reserve across the last five seasons. |
Comparison of effort for each weed type for the last five years
The chart to the left shows the amount of effort in the Reserve in each of the last five seasons for each of the weed types targeted. The comparison here is restricted to the Reserve because of the gradual expansion of weed control into the neighbouring paddocks over those years. Comparison of effort for the Reserve alone therefore provides a better indication of weeding effort required to control each weed type. To see the equivalent chart for the Reserve and neighbouring paddocks combined, open the comparison for the combined Reserve and neighbouring paddocks window.
While there are considerable differences in effort between seasons for some weed types, others are quite close. Notable is the continued decline in effort on briars and woody weeds over the last four seasons that we have been successfully eradicating these weeds. A similar decline can be seen for the Thistles other than Saffron thistles grouping. Effort on Saffron thistles and Paterson's Curse peaked in 2013-14, for reasons that are not yet apparent. It is hoped that the decreased effort required since then is the result of our control effort rather than seasonal effects.
After a considerable decline in effort required for Verbascum since 2011-12, it increased considerably again this season. A detailed analysis suggests that this is the consequence of Verbascum prevalence being dependent on summer rainfall.
For a more detailed discussion of season to season differences, see season comparison page.
|
| |
|
Effort in different paddocks |
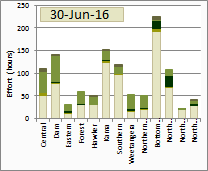
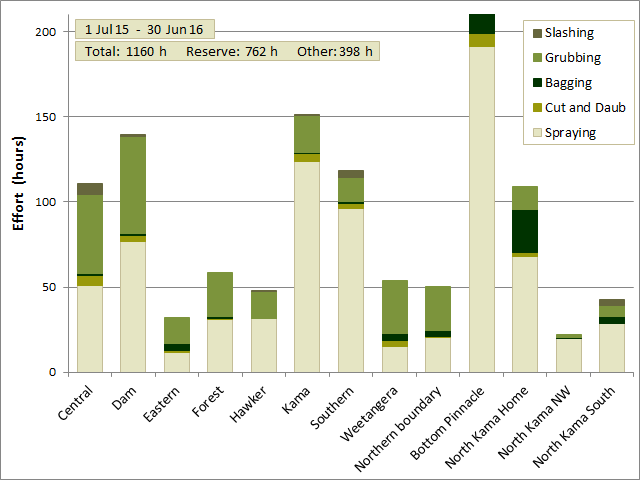
The chart shows the total effort for each paddock, divided into the time spent using different weed control methods.
|
The chart to the left shows the total effort for each paddock, separated into the time spent applying each weed control method.
This chart is presented as total effort in each paddock. In order to judge relative levels of infestation by each weed type in different paddocks, the chart can also be viewed as the effort per hectare in each paddock for each weed type targeted. On that web page it can be seen, among other things, that Central, Dam, Kama and Southern paddocks generally received the most effort/ha (on the Reserve). |
| |
|
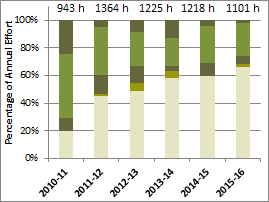
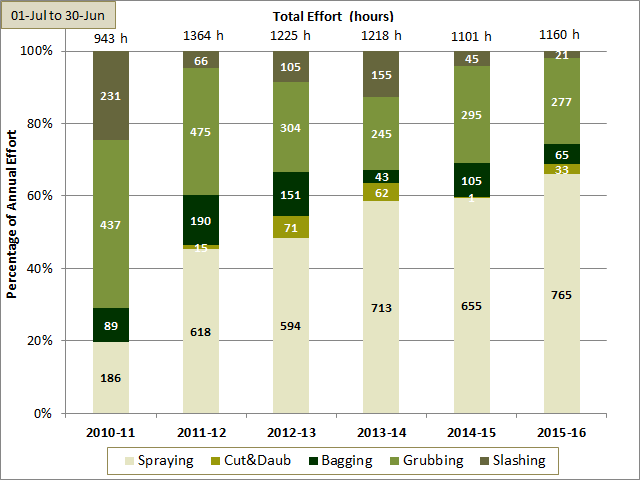
The chart shows the total effort in each year, divided into the time spent using different weed control methods. |
Effort spent on different control methods
This chart shows the total effort in each year apportioned into the different control methods. The percentage effort is shown on the left hand axis and the absolute hours on the chart bars themselves.
Obvious features include: the big increase in spraying after 2010-11, as we emphasised that as the preferable control method; the gradual decrease in bagging after 2010-11 as the increased spraying allowed more effective control of weeds prior to maturity; and a steady decrease in grubbing as a control method as we aim to minimise the soil disturbance causes by using this method. |
| |
|
The chart shows the total effort for each paddock, divided into the time spent grubbing and pulling weeds and that spent spraying.
|