|
|
An important aspect of the Weed Management Plan is monitoring and reporting on our interventions. This includes monitoring our weeding effort to know how our resources have been deployed, and to compare it with the requirements projected in the plan and effort in previous years.
Data on this page is for the year 1 July 2011 to 30 June 2012.
Weeding effort for the current year, updated monthly, can be found at weeding effort. Effort can also be viewed for 2010-2011.
|
| Tip: Hover mouse over chart thumbnail to see full size chart. |
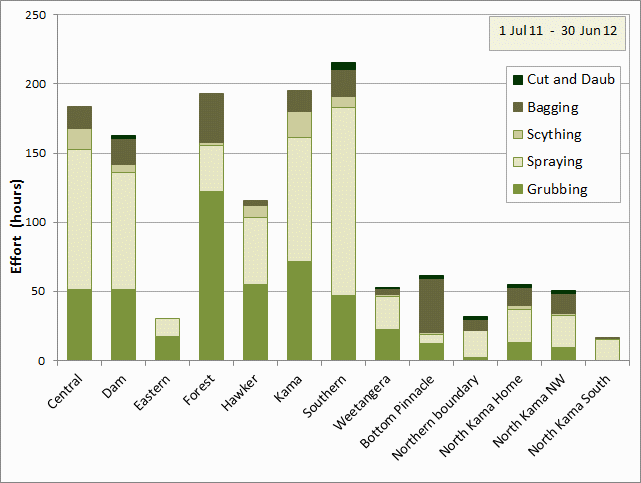
The chart shows the total effort for each paddock, divided into the time spent grubbing and pulling weeds and that spent spraying.
|
Total Effort
Between 1 July 2011 and 30 June 2012, the amount of effort deployed in weed management was 1364 hours:
| Grubbing and pulling: |
475 hours |
| Bagging: |
190 hours |
| Spraying (& daubing): |
633 hours |
| Slashing and Scything: |
66 hours |
This is 421 hours more than last year and 176 hours more than the aspirational target for a full year in the Weed Plan (as discussed in more detail below). This is despite May and June's effort being truncated by the loss of 3 weeks as a result of the park closure.
The chart shows the total effort for each paddock, separated into the time spent grubbing and pulling weeds, that spent spraying, that spent slashing with the scythe, and that spent cutting and bagging seed heads. |
| |
|
 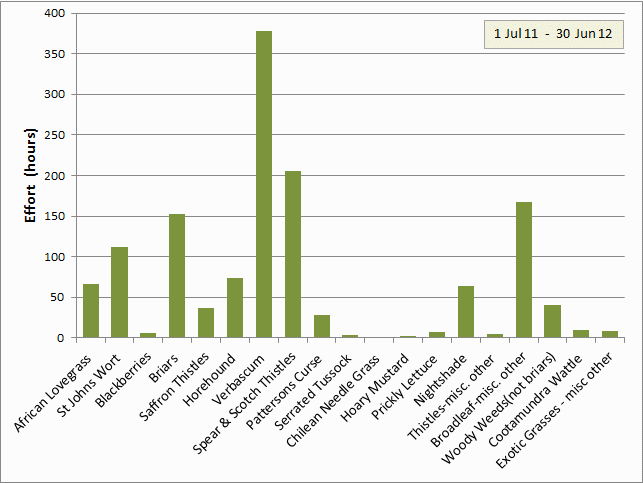
This chart shows the total effort for each weed type across all paddocks. |
Effort for different weed types
This chart shows the total effort for each weed type across all paddocks. Most of the effort in the year to date (28%) has been spent tackling Verbascum, which is quite a contrast to last year. Spear and Scotch thistles have occupied 15% of our time, miscellaneous Broadleaf weeds (mainly fleabane) 12%, Briars 11%, and St. John's Wort 8%.
For the amount of effort spent on each weed type in each paddock, see below. |
|
|
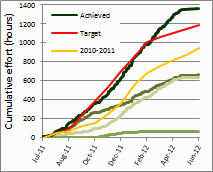 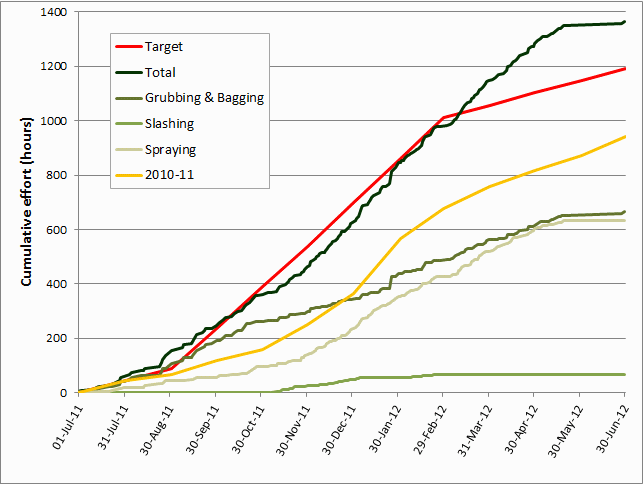
Actual effort compared with the estimated effort required, as functions of time since 01 July 2011.
|
Comparison with targets (see note about targets)
The Draft Weed Management Plan estimated the amount of effort that would be required to effectively control priority weed species on The Pinnacle Nature Reserve. The actual effort is compared with this target, as well as the actual effort from 2010-2011 in the accompanying chart.
The total for the year of 1364 hours was 45% more than the aspirational target and 26% more than 2010-11. The increased effort compared with last year reflects a number of factors, including better weather (less rain) this year, an increase in the number of regular weeding volunteers, an increase in ChemCerted volunteers, increased time available for spraying by some members, and the availability of appropriate chemicals for spraying certain weeds. Our spraying effort is nearly three times that for 2010-11, and it's proving a satisfactory method of dealing efficiently with most weeds that in the past we have grubbed, thereby avoiding unnecessary soil disturbance. Because of its efficiency, we have achieved much better weed control over more of the Reserve this year, despite the prolonged growing season. The unseasonal rain in February had a noticeable effect on our effort, with a levelling out of the cumulative total at the end of the month. Despite even more rain in March (204 mm compared with 133 mm in February), it's distribution was such that spraying was able to continue and the effort rate has returned to that during the rest of Spring and Summer. Unfortunately our effort was impacted by the loss of 3 week's effort in May-June as a result of the Reserve's closure for the annual kangaroo cull.
Note also that this year we put more effort (about 200 hours) into the neighbouring North Kama and Bottom Pinnacle Paddocks. Click to see the split in effort between the Pinnacle Nature Reserve and Neighbouring paddocks compared with our target and last year's effort.
|
| To see our performance against the targets for each weed type, click here. |
| |
|
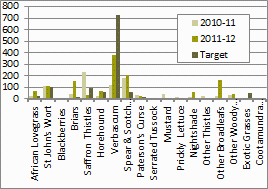 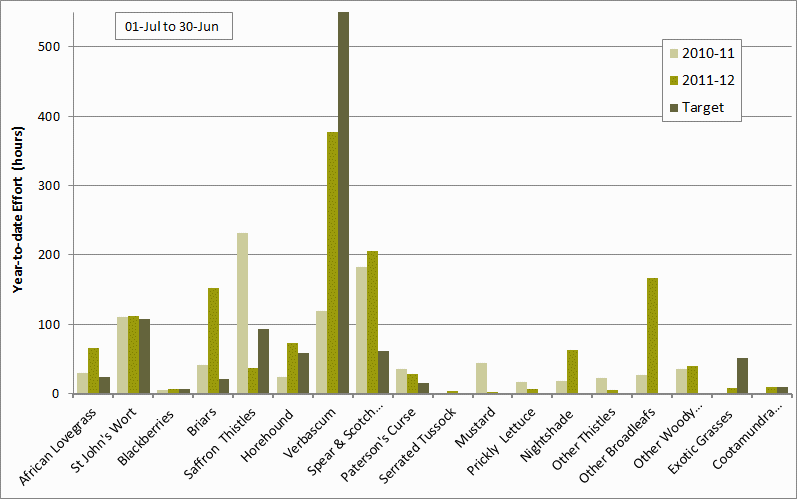
Actual effort compared with the estimated effort required, as functions of time since 01 July 2011. |
Comparison with individual weed species targets
These are shown in detail on the species target page, but are summarised in the barchart to the left (hover over to enlarge), which also compares this year's effort to last year's for each species.
While there are considerable differences between effort and targets for many weed species, others are quite close. The standout is Verbascum. Last year there was much less effort than the target called for, but this was largely because there was much less Verbascum in evidence last year and our effort was absorbed by other species. This is attributed to the difference between the amount of rainfall and the winter temperatures in the two years.
For a more detailed discussion of year to year differences, and comparison with targets, see year-on-year comparison page. |
| |
|
|
What the effort data tells us ...
- The aspirational targets for weeding effort set in the Weed Plan are achievable if the weather is suitable for weeding activities and we have a sufficient number of regular volunteers who are suitably trained and equipped.
- Our efforts are likely to be more efficient and effective this year because (a) we have the ability to spray as soon as required (we didn't receive permission to use the appropriate chemicals for some weeds until well into the growing season last year), (b) we have been able to triple the amount of spraying done, and (c) other experience gained from last year (such as the use of scything as an efficient way to ward off flowering and seeding for some weeds until spraying can be done)
- Effort required for particular weed species is totally different to last year. Clearly some weeds (such as Verbascum) perform much better in years that are not too wet, whereas in wetter years (such as last year) weeds like saffrons and hoary mustard out-compete them. The data we collect from year to year will help us refine this picture of climate-weed interaction. For more details of the comparison between this year and last year, see the year-on-year comparison page.
- General benefits from collecting the weeding effort data and referencing it to locations include:
- It provides hard evidence of the sizeable contribution of our members to the well-being of the Pinnacle Nature Reserve.
- It provides a good guide to the amount of effort required to manage each weed type, especially in those cases where we believe we have treated effectively all the weeds of a given species (as in the case of blackberry).
- The spatial information coupled with the effort provide us with a good indication of the severity of the weed problem in particular locations, and, depending on the weed type and the weather, an indication of how much effort may need to be applied in particular areas each year.
- The spatial information coupled with the date and type of treatment will enable us to assess the effectiveness of of given treatments at certain times of the year.
- And there's no doubt more uses will emerge with time.
So, thanks to all those who logged their effort and provided GPS information about where the effort was expended - it really makes a difference.
A note about targets
The targets defined in the Weed Management Plan were the amount of effort required to provide reasonable assurance that all plants are treated, and that no weeds set seed.
The targets were estimated on the basis of:
- a survey of size and density of weed patches between October and December 2009, and
- tests of the effort required to control a given area/number of each weed.
This was a practical way of estimating targets, but subject to a number of limitations:
- Spring rainfall in Canberra in 2009 (118 mm) was the 16th driest on record, and 30% below average. Weed germination and growth in 2009 would therefore be expected to be less than average.
- Not all weeds were visible at the time of the survey, many being hidden by other weeds, particularly the early maturing grasses.
- Not all weeds may have germinated at the time of the survey.
In contrast, in 2010 for example, Spring was 15th wettest on record, with 255 mm of rain, twice as much as 2009. The germination and growth of weeds would be expected to be much greater in 2010 than 2009, and therefore the targets for 2009 likely to be less than those required to control all weeds in 2010. This was particularly so with the continuation of rainfall and mild conditions in December (the second wettest on record), prolonging the germination and growth of weeds. |
|
Amount of weeding effort for each weed type in each paddock
Hover your mouse over the paddock names on the map below to show charts of the effort for each weed type in each paddock, which shows the amount of effort for each weed type in each paddock. It also gives an indication of the prevalence of each type across different parts of The Pinnacle Nature Reserve, is so far as the effort is related to the need, and therefore to the severity of weed infestation. |
See also:
North Kama Northwest 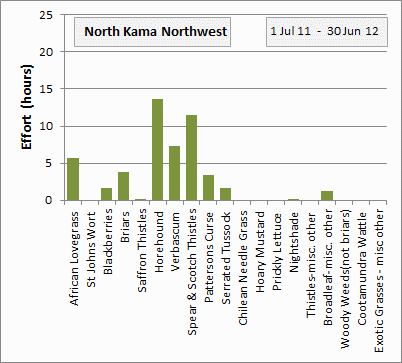
North Kama Home 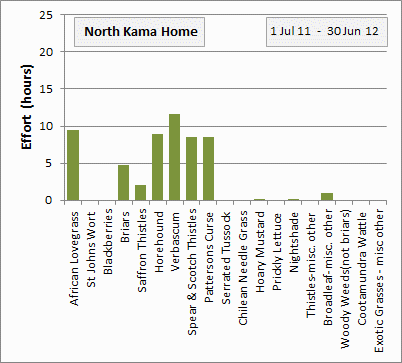
North Kama South 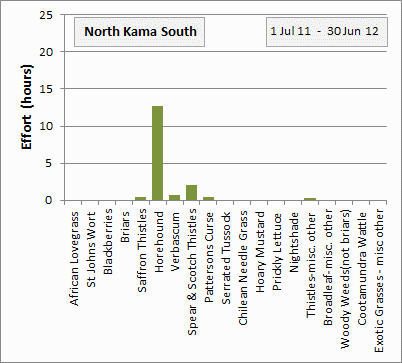
|

The chart shows the total effort for each paddock, divided into the time spent grubbing and pulling weeds and that spent spraying.
|


