|
|
An important aspect of the Weed Management Plan is monitoring and reporting on our interventions. This includes monitoring our weeding effort to know how our resources have been deployed, and to compare it with the requirements projected in the plan and effort in previous years.
Data on this page is for the year 1 July 2012 to 30 June 2013.
Weeding effort for the current year, updated monthly, can be found at weeding effort. Effort can also be viewed for the completed years 2010-2011, and 2011-2012.
|
| Tip: Hover mouse over chart thumbnail to see full size chart. |
|
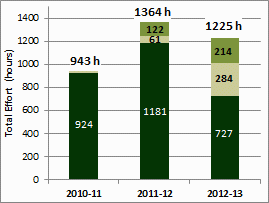
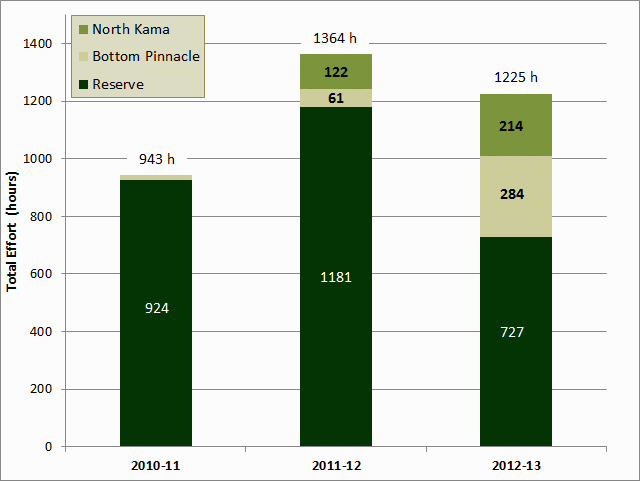
The chart shows the total effort for each of the last three seasons, divided into the time spent in the Reserve, Bottom Pinnacle and North Kama paddocks.
|
Total Effort
Between 1 July 2012 and 30 June 2013, the amount of effort deployed in weed management was 1225 hours.
The chart to the left compares this season's effort with previous seasons and shows how the effort was apportioned between the Reserve, the Bottom Pinnacle and the North Kama paddocks. In 2012-13 40% of the total effort was spent outside the Reserve, and it can be seen that the amount of effort actually spent on the Reserve was less than in previous years. Nevertheless, the weeding team feels that a similar (or better) level of control of target weed species was achieved, thereby allowing more effort to be spent in the neighbouring paddocks controlling weeds with the potential to re-infest the Reserve.
|
| |
|
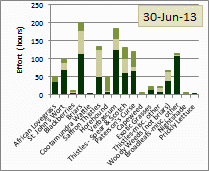 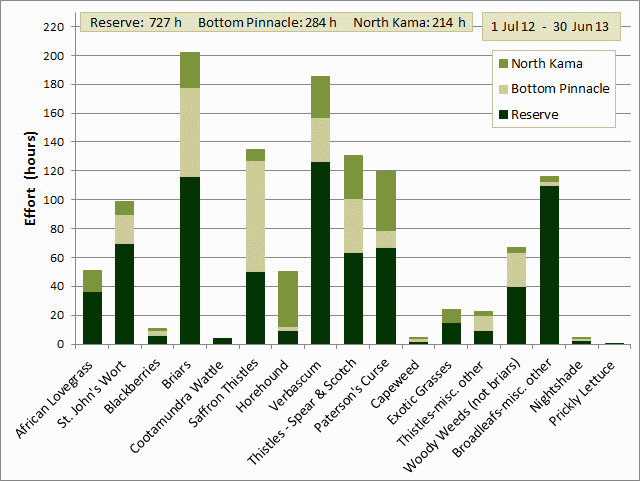
This chart shows the total effort for each weed type across all paddocks. |
Effort for different weed species
This chart shows the total effort for each weed type and how that was distributed between the Reserve and neighbouring paddocks. The greatest total effort (202 hours) was spent on Briars, while the greatest effort in the Reserve was on Verbascum (126 hours).
For the amount of effort spent on each weed type in each paddock, see below. |
|
Reserve |
Other |
Total |
| Verbascum |
17% |
12% |
15% |
| Sweet Briars |
16% |
17% |
17% |
| Broadleafs - misc. other |
15% |
1% |
9% |
| Thistles (non-Saffron) |
10% |
16% |
13% |
| St. John's Wort |
10% |
6% |
8% |
| Paterson's Curse |
9% |
11% |
10% |
| Saffron Thistles |
7% |
17% |
11% |
| Woody Weeds (not briars) |
5% |
5% |
5% |
| African Lovegrass |
5% |
3% |
4% |
| Horehound |
1% |
8% |
4% |
| Other |
4% |
3% |
4% |
|
|
The percentage of total effort for each of the top ten weed species (and the rest) is shown in the table for the Reserve, the combination of Bottom Pinnacle and North Kama (Other) and the total. [As a guide to interpretation, 17% of the total effort spent in the Reserve, 12% of the total effort in the other paddocks, and 15% of the total effort was spent on Sweet Briars].
There is some degree of correlation between the apportioning of our effort for the Reserve and Other paddocks, but some notable differences: a large proportion of effort was spent on broadleafs (mainly Fleabane, but also flatweed and skeleton weed) in the Reserve, but it was not considered a high priority in the neighbouring paddocks; a much larger proportion of time was spent on Saffron thistles in the neighbouring paddocks because they were much more intense, probably as a result of not having been treated in previous years as they were on the Reserve; a higher percentage of effort was spent on St John's Wort in the Reserve because a large amount of spraying was done by PCS contractors in the neighbouring paddocks; and a larger percentage of time was spent on Paterson's curse and Horehound in the neighbouring paddocks because they were both much more widespread there.
|
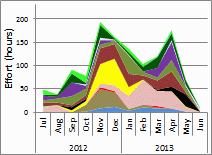 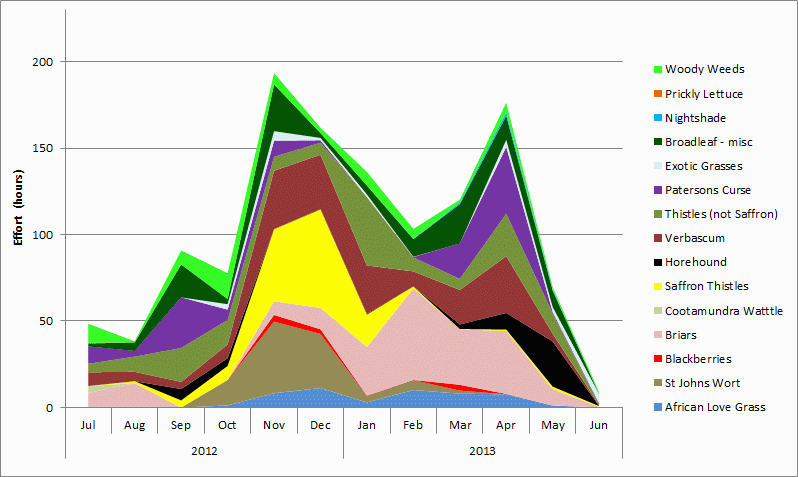
This chart shows the change from month to month of weeding effort for the different weed targets. |
To see how our effort for each weed species changed through the season, hover over the chart to the left, and/or visit the monthly effort page. Monthly effort for each species can also be compared for the past three seasons by visiting the monthly history page.
For an even more detailed view, and a comparison with last season, visit the species
effort over time page. |
| |
|
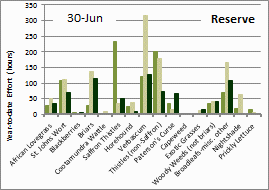 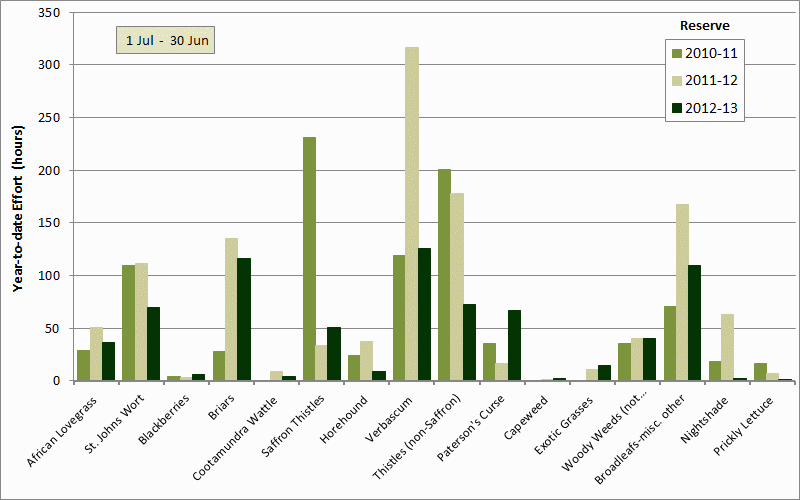
This chart shows the comparison of effort for each weed species targeted in the Reserve across the last three seasons. |
Comparison of species effort with previous years
The chart to the left shows the amount of effort in the Reserve in each of the last three seasons for each of the weed species targeted. Effort is restricted to the Reserve because of the gradual expansion of weed control into the neighbouring paddocks over those years. Comparison of effort for the Reserve alone therefore provides a better indication of weeding effort required to control each weed species. To see the equivalent chart for the combined areas, open the comparison for the combined Reserve and neighbouring paddocks window.
While there are considerable differences in effort between seasons for some weed species, others are quite close. Much more time has been spent on Paterson's curse than in previous years because it has been much more prevalent this year, both in Spring and Autumn. While there was similar effort spent on Saffron thistles to last year, there much less than in 2010-11. This is also in line with changes in prevalence from year to year. There was much less effort spent this year on Verbascum (reflecting the amount of seed head bagging required in the Reserve last year and the considerably lower incidence of V. thapsus this year) and Spear and Scotch thistles, which seem to have been less prevalent this year than in previous years.
For a more detailed discussion of year to year differences, see year-on-year comparison page.
|
| |
|
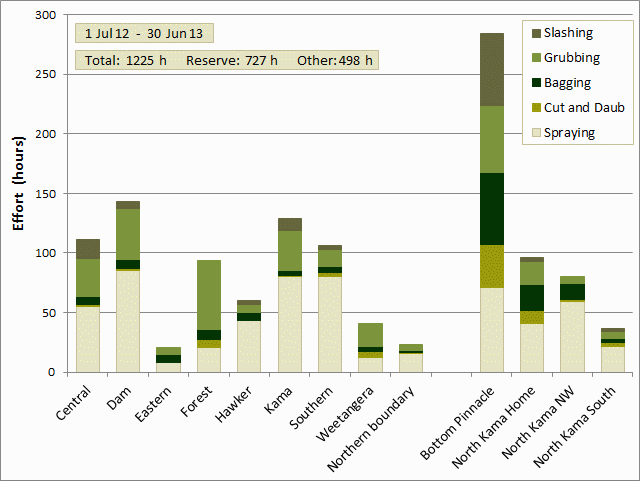
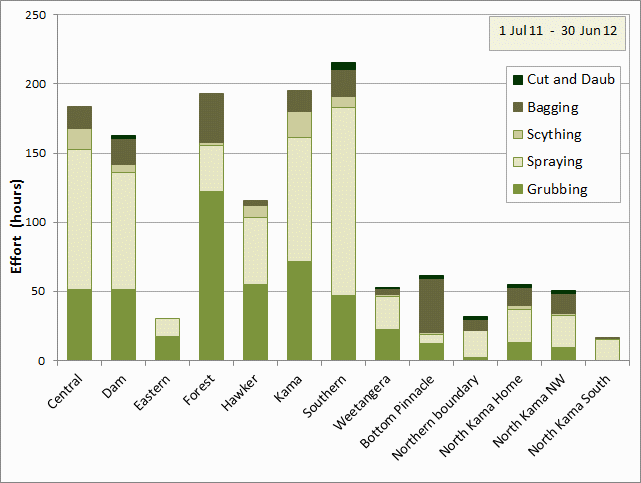
The chart shows the total effort for each paddock, divided into the time spent using different weed control methods.
|
Effort in Different Paddocks
The chart to the left shows the total effort for each paddock, separated into the time spent applying each weed control method.
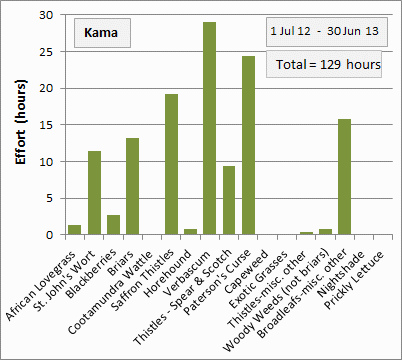
This chart is presented as total effort in each paddock. In order to judge relative levels of infestation by each weed species in different paddocks, the chart can also be viewed as the effort per hectare in each paddock for each weed species targeted. On that web page it can be seen, among other things, that the Eastern paddock received the greatest effort per hectare for St. John's wort (perhaps a little surprising to some). Kama and Central paddocks received the most effort/ha (on the Reserve) for Saffron thistles, and Kama also required the most effort/ha for Verbascum and Paterson's curse of any of the paddocks on the Reserve. |
| |
|
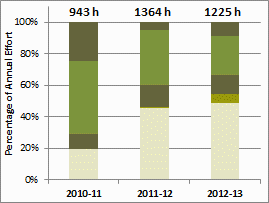
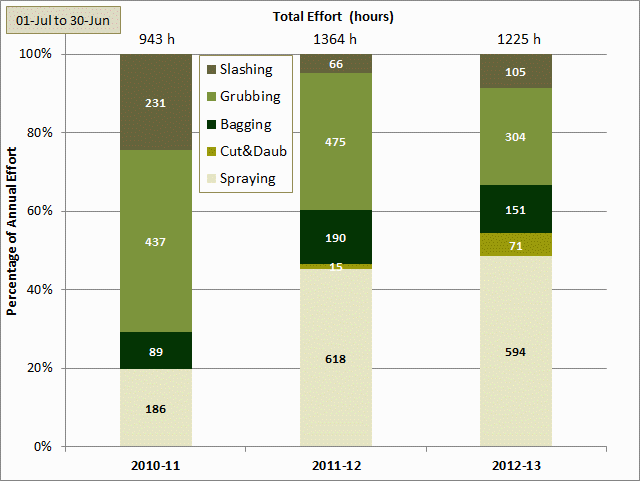
The chart shows the total effort in each year, divided into the time spent using different weed control methods. |
Effort spent on different control methods
This chart shows the total effort in each year apportioned into the different control methods. The percentage effort is shown on the left hand axis and the absolute hours on the chart bars themselves.
Obvious features include: the big increase in spraying after 2010-11, as we emphasised that as the preferable control method; the big decrease in slashing after 2010-11 when there was a bumper Saffron thistle crop; the slow emergence of our usage of cut and daub as a technique; and a steady decrease in grubbing as a control method as we aim to minimise the soil disturbance causes by using this method. |
| |
|
A note about targets
In previous years we have compared our effort with the targets defined in the Weed Management Plan. After three years of concerted weed control, those targets have lost a lot of their relevance, and we have now discontinued using them.
The Weed Management Plan targets were the amount of effort estimated to be required to provide reasonable assurance that all plants are treated, and that no weeds set seed. They were estimated on the basis of:
- a survey of size and density of weed patches between October and December 2009, and
- tests of the effort required to control a given area/number of each weed.
This was a practical way of estimating targets, but subject to a number of limitations:
- Spring rainfall in Canberra in 2009 (118 mm) was the 16th driest on record, and 30% below average. Weed germination and growth in 2009 would therefore be expected to be less than average.
- Not all weeds were visible at the time of the survey, many being hidden by other weeds, particularly the early maturing grasses.
- Not all weeds may have germinated at the time of the survey.
Since the survey, other factors have affected the relevance of those targets:
- as our weeding methods take effect, the patterns and amounts of weed distributions are changing
- we have expanded our weed control away from the Reserve, for which the targets were set, to include the neighbouring paddocks, where 40% of our effort was spent in 2012-13
Therefore the targets for individual weed species and for total effort estimated in the Weed Plan are no longer a useful guide for assessing our performance. Instead, more emphasis is placed on comparing effort from year to year and relating changes in that effort to changes in weed prevalence in response to climate and our control activities. |
|
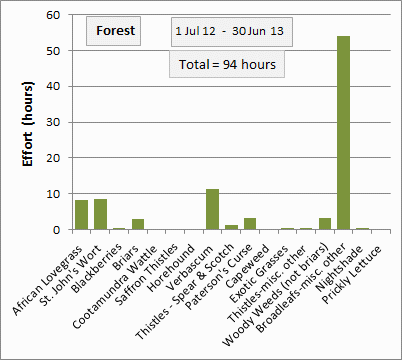
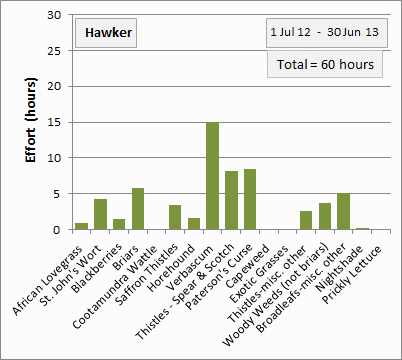
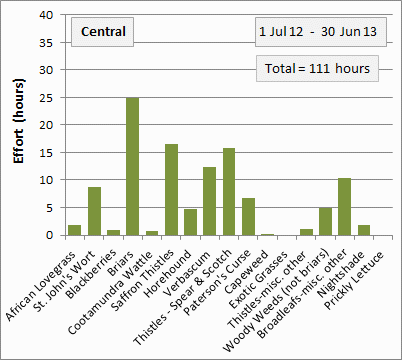
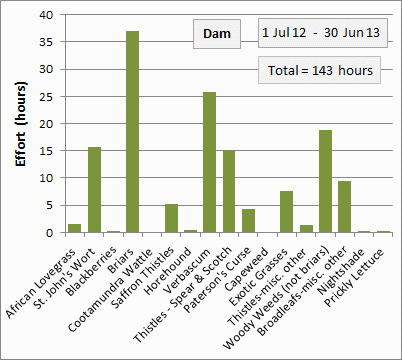
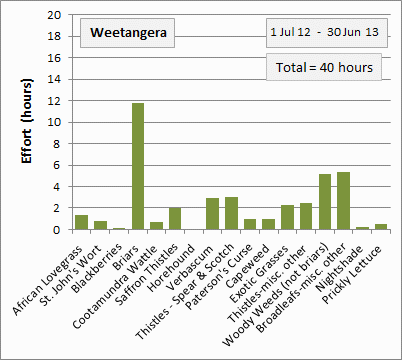
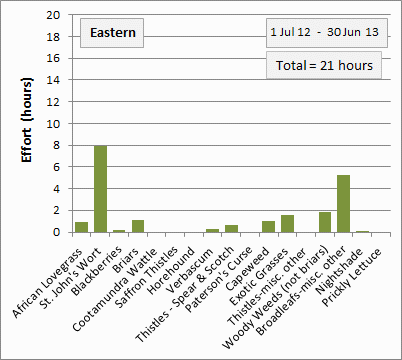
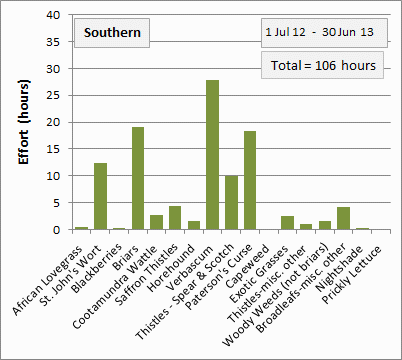
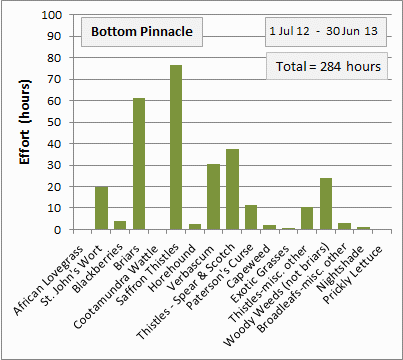
Amount of weeding effort for each weed type in each paddock
Hover your mouse over the paddock names on the map below to show charts of the effort for each weed type in each paddock, which shows the amount of effort for each weed type in each paddock. It also gives an indication of the prevalence of each type across different parts of The Pinnacle Nature Reserve, is so far as the effort is related to the need, and therefore to the severity of weed infestation. |
See also:
Northern Boundary 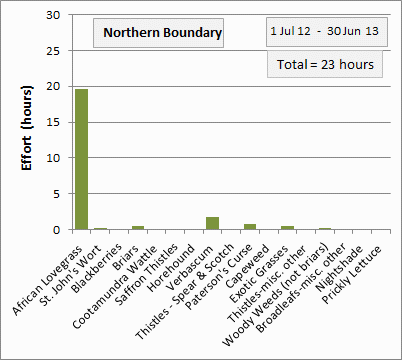
North Kama Northwest 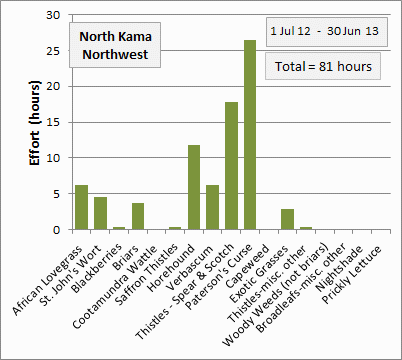
North Kama Home 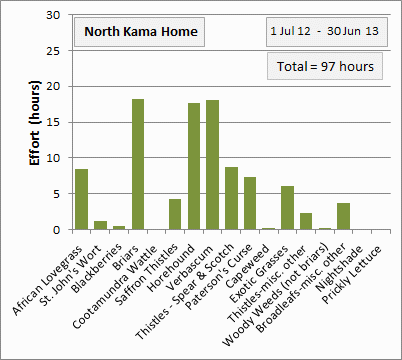
North Kama South 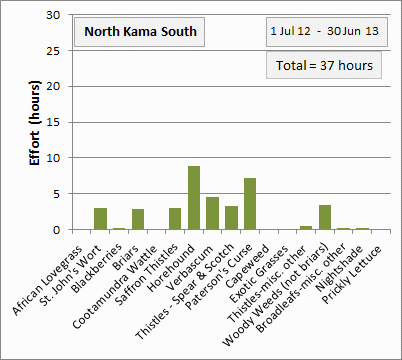
|
The chart shows the total effort for each paddock, divided into the time spent grubbing and pulling weeds and that spent spraying.
|