Friends of The Pinnacle   weeding effort  2022 - 2023  
  
home page what's on news


search tips advanced 
site search by freefind


An important aspect of the Weed Management Plan is monitoring and reporting on our interventions. This includes monitoring our weeding effort to know how our resources have been deployed, and to compare it with the requirements projected in the plan and effort in previous seasons.

Data on this page is for the season 1 July 2022 to 30 June 2023. Weeding effort for the current season, updated quarterly, can be found at weeding effort.

To view data from previous seasons, select the required season from the "Past effort" menu above, then select overview.


Tip: Hover mouse over chart thumbnail to see full size chart.

Total Effort


The chart shows the total effort for each of the last five seasons, divided into the time spent in the Reserve, Bottom Pinnacle and North Kama paddocks.

Between 1 July 2022 and 30 June 2023, the total effort deployed on weed control was 1001 hours. This was the largest total since 2015-16.

Effort spent on the Reserve* itself (97% of the total**) was the second largest since our records began, surpassed only by 2011-12.

Since 2020 and the onset of 3 seasons of above average rainfall our effort has been more reflective of our capacity than of the effectiveness of our weed control. Control of some weed species has had to be abandoned in large areas of the Reserve has had to be abandoned. For St. John's Wort, one of the highest priority weeds, we have only had the capacity to treat 46% of the Reserve, concentrating mainly on the most biodiverse areas. Contractors treated a further 11% in Kama Link and along it's northern boundary.

[* Note: effort for the Reserve includes effort in the Kama Link paddock (2016 Extension) for all seasons.]

[** Note: between 2011 and 2016 much more effort was spent on weed control in areas adjacent to the Reserve; since 2016 reduced capacity has required us to confine our efforts to the Reserve and some immediate buffer strips.]

Another feature of the effort in recent seasons has been the increasing proportion spent in Weetangera paddock (up to 40% of total effort), as examined in more detail below. For this reason it has been separated out from the rest of the Reserve for many of the analyses here.


Effort for different weed types


This chart shows the total effort for each weed type across all paddocks.

This chart shows the total effort for each weed type. The largest effort was spent on miscellaneous Broadleaf Weeds* (290 h, 80% in the Weetangera paddock), closely followed by St. John's Wort (246 h). The next most effort was for Thistles other than Saffron Thistles (125 h) followed by Verbascum (97 h) and the minor grass weeds (84 h, 90% in the Weetangera paddock. Together these accounted for 83% of total effort.

[*miscellaneous Broadleaf Weeds includes Hoary Mustard, Prickly Lettuce, Nightshade, Tragopogon, Plantain, various 'flatweeds', Fleabane, Paddy melon and Sorrel which are largely rated as weeds of minor concern.]

Reserve
Misc. Broadleaf weeds 30%
St. John's Wort  25%
Thistles (non-Saffron) 13%
Verbascum 9%
Minor Exotic Grasses* 9%
Other Woody weeds 6%
Briars and Blackberries 4%
All other 5%

* Minor Exotic Grasses excludes African Lovegrass, Serrated Tussock and Chilean Needlegrass

The percentage of total effort for each of the top 7 weed types (and the rest) on the Reserve is shown in the table.

There were large increases compared with last season in the percentage of effort spent on miscellaneous Broadleaf Weeds, Woody weeds, Briars and Blackberries and Minor exotic grasses, while there were large decreases in the percentage of effort spent on Verbascum and Thistles.

The amount of effort spent on each weed type in each paddock can be seen at the following page: relative prevalence of each weed type in each paddock.


This chart shows the comparison of effort for each weed type targeted in the Reserve across the last five seasons.

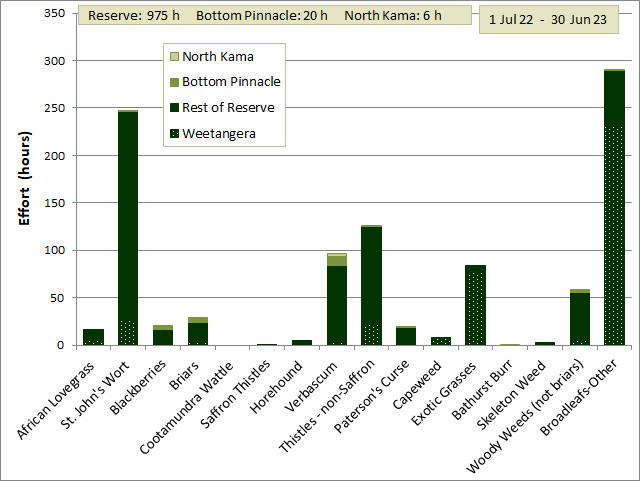
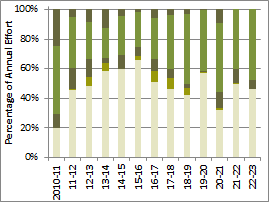
Comparison of effort for each weed type for the last five seasons

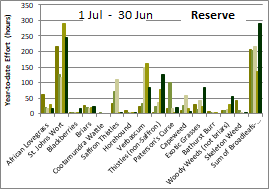
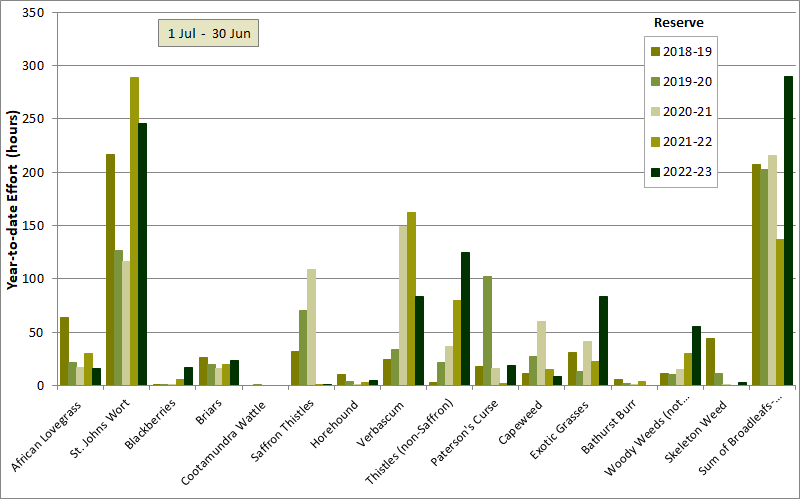
This chart shows the amount of effort in the Reserve in each of the last five seasons for each of the weed types targeted. The comparison here is restricted to the Reserve but the equivalent chart for the whole area can be seen by clicking the following link: comparison for the combined Reserve and neighbouring paddocks.

The differences between seasons since the 2019-20 season do not reflect the effort required to control each weed type as they did in previous seasons because we have not had the resources to maintain treatment of each weed type across the whole reserve. The exceptions are Verbascum, Briars, Blackberries and other Woody weeds.

Effort on Verbascum peaked in 2015-16 and then tailed off until the 2020-21 season. It is believed that this is strongly linked to rainfall. A detailed analysis up to 2021 suggested Verbascum prevalence is primarily dependent on summer rainfall but also that other factor(s) affect it. Verbascum prevalence in 2021 was accurately predicted by the 2020-21 summer rainfall, but in 2022 was under predicted by the 2021-22 summer rainfall. Despite summer rainfall in 2021-22 being twice that in 2020-21, Verbascum prevalence was similar in 2022 to that in 2021. Summer rainfall for 2022-23 was similar to that in 2020-21 and so far Verbascum prevalence in 2023 is similar to that in 2021.

Briars, which have been closely monitored since 2011, decreased steadily from an average density across the Reserve of 44 briars/ha in 2012-13 to an average of 2.3 briars/ha between 2021-20 and 2021-22. There has been a slight bounce in 2022-23 to 3.7 briars/ha following the exceptionally wet season of 2021-22 but the density is still less than the 2018-19 season when it was 5 briars/ha. (see also the detailed analysis of briar eradication success).

Blackberries have also been closely monitored and treated since 2010. After falling to very low numbers in 2019, they have rebounded in the last two seasons to very high numbers in 2022-23. Details of these changes can be found at Progress in controlling Blackberries.

Other Woody weeds are not as closely monitored and recorded as briars and blackberries, but based on the data available they have shown a similar decline and then rebound in numbers to that shown by Blackberries.

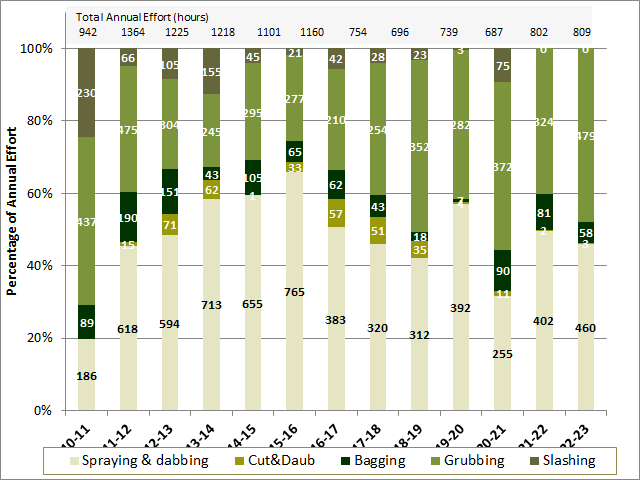
Otherwise, effort is quite variable from season to season depending on seasonal conditions and available effort.

For a more detailed discussion of season to season differences, see season comparison page.


Effort in different paddocks


The chart shows the total effort for each paddock, divided into the time spent using different weed control methods.

The chart to the left shows the total effort per hectare for each paddock. As foreshadowed in the overview above, the effort in Weetangera paddock is quite disproportionate to it's area (29 h/ha compared with 4.2 h/ha for the rest of the Reserve combined). As shown in the weed type chart above this effort has largely gone into removing miscellaneous broadleaf and grass weeds rated as a minor risk (see weed risk ratings), a combined 23.4 h/ha. Effort in Eastern paddock was quite high also with a lot of work being done to control St. John's Wort and Fleabane.


The chart shows the total effort in each season, divided into the time spent using different weed control methods.

Effort spent on different control methods

This chart shows the total effort in each season apportioned into the different control methods. The percentage effort is shown on the left hand axis and the absolute hours on the chart bars themselves.

Spraying dipped below 40% of effort in 2011-12 or the first time since our first full season of spraying, but has rebounded in the last two seasons.


The chart shows the total effort for each paddock, divided into the time spent grubbing and pulling weeds and that spent spraying.


Summary of web pages showing more detailed analyses
of weeding effort
total effort for each weed type compared for the last 5 seasons
effort per hectare in each paddock for each weed type targeted
effort in each paddock for each weed type targeted
effort for each weed type in each paddock (via hover map)
monthly effort for each weed type compared for the all seasons
Blackberry control progress
Briar control progress
Verbascum control indicators


© Friends of The Pinnacle