Total Effort |
|


|
Between 1 July 2025 and 30 June 2026 the total amount of effort spent on weed control was 1029 hours, 97% within the Reserve*. This was 14% more than last season and 8% more than the average for the previous 15 seasons of monitoring. When Weetangera paddock is excluded from calculations (as explained below **) effort for the rest of the Reserve was 28% more than last season and 15% more than the average for the previous 15 seasons.
* the small amount of effort outside the Reserve was aimed at creating buffer zones around the boundaries.
** Note that data for Weetangera paddock is separated from the rest of the Reserve in this and some of the charts below because of the disproportionate amount of effort there in recent seasons with a large proportion of that effort being very intensive, associated with preparing and maintaining planting sites.
|
Spraying Effort |
|
|
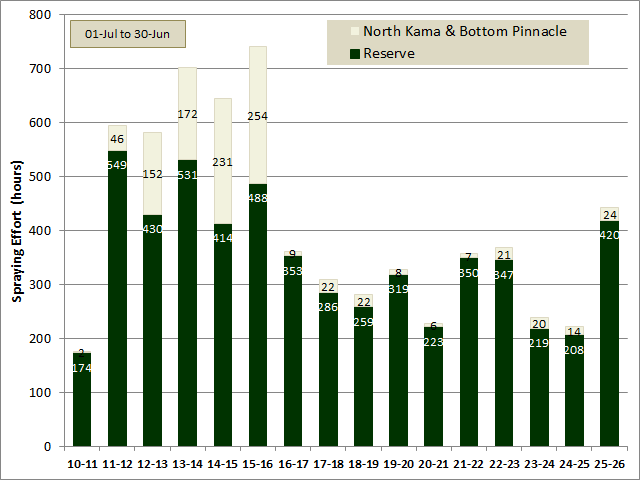
Spraying with the appropriate selective herbicides is the most efficient way of effectively killing weeds without causing soil disturbance. We therefore aim to maximise the amount of spraying time as a proportion of our total effort. Up to this season there had been a gradual decline in spraying time as a proportion of total effort both for the Reserve and for all areas combined because of a decline in the number of sprayers and their availability. This season, however, spraying was 43% of all effort, almost doubling the amount spent in the previous two seasons as a result of increased sprayer time available. |
| |
|
Total effort in different management areas (paddocks) |


The chart shows the total effort for each paddock, divided into the time spent using different weed control methods. |
This chart shows the effort for the season to date in each paddock (see paddock map), separated into the time spent applying each weed control method.
Kama Link paddock, closely followed by Weetangera paddock received the greatest total effort, followed by Dam, Southern, Kama, Central, Eastern, Hawker and the Forest.
This chart also shows the distribution of spraying effort. The limited amount of spraying time we have is primarily directed to paddocks with areas having the greatest density and diversity of native plant species. The exception is the spraying effort in Bottom Pinnacle to control key weed species in a buffer zone along the Reserve boundary.
|


The chart shows the total effort per ha for each paddock. |
The areas of the paddocks differ considerably, so a better way to compare weeding effort (and to some extent weed prevalence) between paddocks is to express the effort as hours per hectare.
On this basis, Weetangera received the greatest amount of effort, followed by Eastern, Southern, Dam, Kama, Central, Hawker and Forest.
|
| |
|
Total effort for different weed types |


This chart shows the effort for each weed type across all paddocks for the season to date.
|
... for the season
This chart shows the total effort for the season so far for each weed type, separated into different parts of our treatment area as described below.
Most effort (327 h; 32% of total) was spent on St. John's Wort. This was followed by the group of uncategorised low to medium risk broadleaf weeds* largely in Weetangera paddock (148 h, 14%) then Mustard (127 h; 12%), Paterson's curse (116 h, 11%) and Saffron thistles (81 h, 8%). All other weeds combined accounted for less than 25% of effort.
*this incudes Prickly Lettuce, Nightshade, Fleabane, Tragopogon, Plantain, Flatweeds, Paddymelon and Sorrel.
|


This chart shows the effort for each weed type for each month of the season to date.
|
... for each month
The chart to the left summarises the effort for the different weed types for each month this season, showing how the effort on different weed types changed from month to month. For example we see the ramping up of St. John's Wort effort in October peaking in January, the spring and autumn treatment of Briars and Blackberries, the periodic treatment of African lovegrass and the concentration of effort on Saffron thistles in spring and early summer.
It is also worth comparing this chart with those for all previous seasons.
|
|
|
... also
|
| |
Effort for different weed types in each management area (paddock) |
|
|
... via a hover map
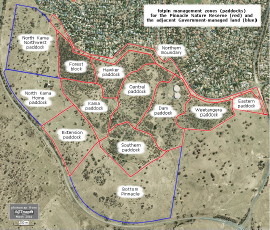
Click the image on the left to open a full-size map in a new window.
Hover your mouse pointer over any paddock to see the effort that has been spent in that paddock in this season on each weed type.
|

|
... relative effort
This shows, for each weed type, the effort that has been spent in the season to date in each paddock.
Effort is expressed per hectare to take into account the different paddock sizes. This allows one to judge relative levels of infestation by each weed type in different paddocks.
The data can be also viewed as hours of effort in each paddock for each weed type. |
| |
|
|
|





 or refresh
  button to make sure you are viewing the most up-to-date images.